These are the results only for 2005-2006. I will collect the other data too, but I’d rather study this first, before I go further I removed two types of powerplays from these results: roughing and puck over the netting.
- How much more likely is a team down by one going to get a power play than take a penalty?
They are 14% more likely to get a powerplay (7.12 PP/Hr vs 6.24 PP/Hr) (This is also statistically significant…)
- Same question, but only on the road.
It doesn’t seem to make a difference [compared to question 1], as it’s 13% (less, but not statistically significantly less). (7.28 vs 6.44) They just get more penalties in general.
- Same question, but only Eastern Conference teams.
Same as 1 or 2? I’ll go with 2, which is 16% or (7.23 PP/Hr vs 6.25 PP/Hr).
- Same question, but only in the 3rd period.
Third period it jumps to 18% (in regards to question 1 not 2 or 3…), or (4.80 PP/Hr vs 5.68 PP/Hr - notice how much lower as well…). This is significant.
- How long into a power play is the average PPG scored?
This can be done, reasonably easily to approximate, take powerplay opportunities and divide by total powerplay time (over the team). In other words someone else can figure this out. The quickest approximation: 8103576 seconds of powerplays in 14394 powerplays, which works out to about
- How long after a faceoff is the average goal scored? Is there a cluster shortly after faceoffs?
Basically goals after face-offs occur in an exponentially decaying pattern (with an initial lag due to near impossible scoring time) as seen below; this is the result of scoring following a Poisson distribution.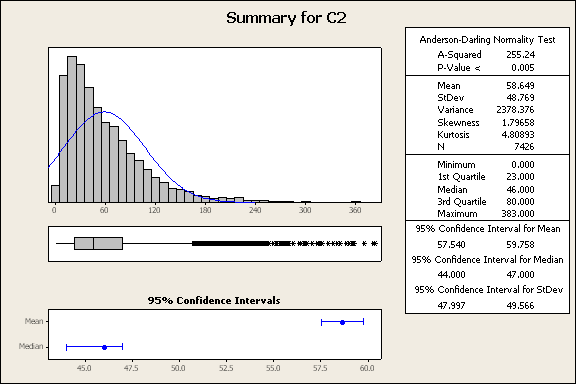
- Same question, but only after icings.
One has to remember that in hockey, an offensive zone win or loss just changes the amount of time to get to the net, so it should not effect the distribution significantly, but just the average. So it appears it takes about 7 seconds to get into the offensive zone from the neutral zone. You can see this graph, it has a few extra “humps”. Also much of "humps" come from the fact that there were only540 goals after icings, compared to 7426 goals (ok I'm missing a few).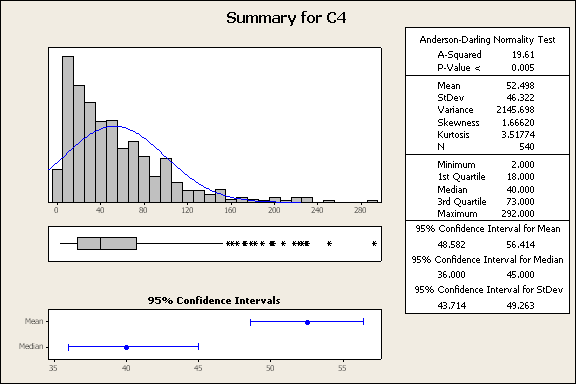
- Given two specific teams and a tied score, who is likely to score first?
The better team.
- How likely is it that the other team scores next?
Depends on how good each team is, this is answered at Hockey Analytics in their in depth article: Poisson Toolbox
- Compare pre-lockout to post-lockout, regular season to postseason, etc.
I’ll add it to my to-do list. I should add: studying post season is extremely difficult as teams play the same team four to seven times and a lot of hockey is determined by oppoenents.
2 comments:
Wow. Unbelievably fast. A few comments:
Some of those 10 were just 'for examples' of subsets that might be worth comparing, such as east vs. west trends, or period vs. period trends. It wasn't so much about the answer to the question I asked, but these might be interesting subsets that may show different trends.
My question about 'icings' was really to think about the effect of not being able to change lines this year. Maybe it will show something against last year's numbers (though there's no rush to do it right now).
I'm particularly interested in the notion of 'make-up' power plays, where a team that's
a) trailing on the scoreboard
b) had less power plays thus far in the game
c) had less power play goals thus far in the game
might have a referee-biased edge in getting the next power play. This year especially, with extra penalties being called, I feel that a lot of the comeback wins may have been somewhat 'contrived', but I'm not sure how to show it.
Now I could understand why a trailing team would have an edge (attacking vs. defending, perhaps), but comparing against pre-lockout results might show something. Also here is where a playoff comparison might be interesting.
Thanks a lot for the number-crunching. This is great. If you want to later, I would also be interested in a post about the structure of your data. Might help me understand what you're doing (or working with) a little more.
I'm particularly interested in the notion of 'make-up' power plays, where a team that's
a) trailing on the scoreboard
b) had less power plays thus far in the game
c) had less power play goals thus far in the game
might have a referee-biased edge in getting the next power play. This year especially, with extra penalties being called, I feel that a lot of the comeback wins may have been somewhat 'contrived', but I'm not sure how to show it.
Detailed expanation of powerplays: Penalties – The bigger picture
Post a Comment