During one of mc79hockey's (Tyler's) Ramblings it was mentioned that Chris Snow was trying to get 10 better statististics. In the comments a reader noted that the NHL keeps track of X_CORD, Y_CORD in the SportsTicker format. CBS sportsline is the only website that uses this data to make pretty pictures of where shots come from, but no one is doing any analysis on such data. You can also see that they are recording where these shots are shot at in the net. Both are very valuable pieces of information. I hope CBS doesn't get mad at me for doing this. Getting the information is a lot easier than getting information from the NHL. As they're stored in convient '~' delimited lists with items seperated by commas. Each game is around 124kb, so it'll take up ~150MB for a season's worth of games.
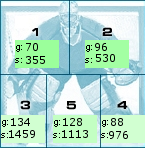
 Location on the net is interesting in and of itself, of course figuring out exactly where a shot is headed isn't trivial, but on average it should be correct. You can see shots that are off the ground are about twice as likely to go in the net.
 Where players shoot, however is even more interesting. I've initially looked at the three basic things you can look at when you're analyzing shots: shots, goals and shooting percentage. Ok the picutres are a little crude, I wanted to do this quickly. You can see on the percentage diagram has a few shots that always go in (outside the offensive zone), these are likely empty net shots (or else I guess they catch the goalie off guard). In the percentage diagram you can see that players can score from far locations at the correct angle. You can also see that shots closer
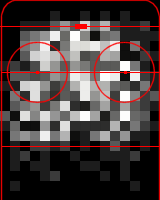 to the net go in much more frequently. The shot diagram (the second one) it shows how many shots a location gets relative to all other locations. What I find interesting is how evenly distributed the shots are, yet shots from a certain distance have very bad odds of going in the net. In the third diagram I have goals (with the same relative "base" as shots), what I noticed is the 45o
 You can see more goals seem to be scored on the right side of the net over the left.
I haven't really looked too much into this data and I only have around 5000 shots meaning this data isn't very accurate, but this looks promising so long as CBS continues publishing this data (and doesn't kill me for using it).
 Location on the net is interesting in and of itself, of course figuring out exactly where a shot is headed isn't trivial, but on average it should be correct. You can see shots that are off the ground are about twice as likely to go in the net.
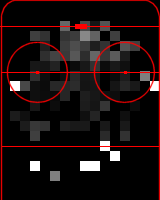 Where players shoot, however is even more interesting. I've initially looked at the three basic things you can look at when you're analyzing shots: shots, goals and shooting percentage. Ok the picutres are a little crude, I wanted to do this quickly. You can see on the percentage diagram has a few shots that always go in (outside the offensive zone), these are likely empty net shots (or else I guess they catch the goalie off guard). In the percentage diagram you can see that players can score from far locations at the correct angle. You can also see that shots closer
 to the net go in much more frequently. The shot diagram (the second one) it shows how many shots a location gets relative to all other locations. What I find interesting is how evenly distributed the shots are, yet shots from a certain distance have very bad odds of going in the net. In the third diagram I have goals (with the same relative "base" as shots), what I noticed is the 45o
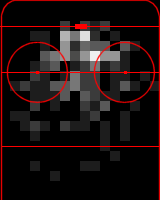 You can see more goals seem to be scored on the right side of the net over the left.
I haven't really looked too much into this data and I only have around 5000 shots meaning this data isn't very accurate, but this looks promising so long as CBS continues publishing this data (and doesn't kill me for using it).
6 comments:
As always, JG, top notch. Again, though, there's some travesty here.
I assume there's no correlation with this data and stuff like power plays, but take what you can get, I guess.
It's a real shame that the base data and you are so separated. I wish I was somebody important so I could rectify that.
The next step is to find a way to connect the play-by-play shots and these shots (it's going to be a challenge). Then I can create a better shot quality model. (including PP/SH/EV rebounds etc.)
It's really quite a amazing how different this is from the official sheets shots though.
Even if I cannot do that I can still figure out what goalies in net, whether it's a PP etc. I'll download a few games see what is actually happening to see how these things work exactly etc.
It would be better if the NHL made these official.
This is some great stuff, but how do we reconcile the problems with the Shot Chart data vis-a-vis the NHL play-by-play and game summaries? The information doesn't seem to match up. Time of play is completely off, totals by player are wrong, etc.
For instance, Jason Arnott and Paul Kariya's Shots On Goal differs between the Shot Chart and the box score.
If we could trust what we're working with here, it could the start of some really great analysis...
You cant trust this data because it's LIVE. The NHL fixes up their scoresheets, but this data comes from the reflexes of those guys at ice level and they'll make mistakes. I also suspect that the data is incomplete, CBS might miss something from SportsTicker due to problems with their code, or who knows what (based on initial inspection). However, if I could even get 50% of this data matched up to the real data I have something to work with.
I noticed in general there are shots missing (maybe it looks like it's going wide?) in this set, rebounds are hard to catch live. But I should be able to get an algorithm that gets 80% agreement. If I can't get 80% agreement I'll just assume CBS's data is quite arbitrary...
I'll have to draw the data down and run it up against what I've got for PBP. I was looking at that game in particular by hand, and wasn't finding anything that matched up.
That said, it's better to work with imperfect data and understand that, than to throw our hands up and pretend there's nothing to learn...
Is data still populating this way? Or is SportsTicker still a functioning group? A few of teh links here are now dead and I was wondering if you had any follow-up info 2 years later.
Post a Comment