November 28, 2006

Individual Player Contributions

I've been working on many methods to scale out the line effects, this one appears to be the most promising at this point. Not to make any comparisons, but David Johnson has created one as well.

Method
I assume players scores are added linearly and that the line effects are primarily caused by pairs (this method can be extended to 3's, 4's or even 5's). Before going into the details I'll provide some quick short had I12 = I12 = total ice time player 1 and player 2 spent together, S1 = score - goals/hour for player 1, G12 = G21 - expected goals (based on shots for/against) while player 1 and player 2 were on the ice. Now I assume that I12*(S1+S2)/2 ~ G12 that is to say that the average between the two players goals per hour multiplied by ice time should be approximately the number of goals for/against. So if one player is very defensive and the other is terrible defensively they should be average defensively together. Now I know G12, that is to say I know how many (expected) goals for and against for any combination of players and I also know how much ice time every player has spent with any pair. But, I do not know S1 and S2, these are the individual scoring statistics (units: goals/hour). Now depending on the team there are 30 or so players who have played a game with the team so there are 30!/(28!*2!) = 435 equations, with 30 unknowns. Using these variables I can simply calculate the coefficients using a regression (no constant though). I wrote my own regression code for this matrix and as such I don't have error details: I don't know how well it performs.

Benifits:
  • The benefit is that this algorithm will not alter the actual statistics significantly so if, for example, one Sedin has 1 extra goal compared to the other they will still be rated equally.
  • It also allows significantly different scores for players who do spend significant time together given significant scoring differences, due to the fact that: a lower S1 can be made up by a higher S2.
  • It doesn't chase low minute players statistics as the coefficients will be small and will have a smaller squared error.
Negatives:
  • It produces extremes periodically (negative goals for/against), you can't score negative goals for...
  • The scoring rates solutions (S1, S2) aren't very comparable between teams or even fully understandable how they got there.
  • Since S1 and S2 aren't very logical, this leaves me multiplying by ice time to get an approximate "individual plus minus" statistic.
I haven't tested it with past data and this season doesn't have enough data to make these results anything but full of problems, but I primarily posting this for a reader response, that is to say, for people to criticize or compliment the results to see if I should continue this development. I find it interesting to see the offensive numbers (Plus) vs. defensive numbers (Minus). D just calculates the difference between them. I'm just posting the Northwest division to start with.

Vancouver


NLastnameIPlusMinusD
1SEDIND603029
2SEDINH573720
3GREENJ372116
4KESLERR463016
5NASLUNDM534013
6KRAJICEKL50409
7BIEKSAK45387
8BULISJ3436-2
9MITCHELLW5760-3
10FITZPATRICKR4953-4
11MORRISONB2531-6
12SALOS4855-7
13COOKEM3744-7
14LINDENT1119-8
15OHLUNDM4757-11
16PYATTT2337-14
17CHOUINARDM1329-16
18BURROWSA1835-17

Minnesota


NLastnameIPlusMinusD
1BOUCHARDP47434
2KOIVUM3131-1
3RADIVOJEVICB3741-4
4BURNSB2028-8
5JOHNSSONK4757-10
6BOOGAARDD317-14
7CARNEYK2642-16
8WALZW1735-18
9WHITET4161-20
10ROLSTONB4769-22
11VEILLEUXS1538-23
12DEMITRAP3765-28
13PARRISHM1544-29
14SCHULTZN3268-36
15SKOULAM4381-37
16FOSTERK3271-39
17NUMMELINP4091-51
18DUPUISP1571-56
19SMITHW1979-60


Edmonton


NLastnameIPlusMinusD
1BERGERONM533023
2THORESENP392217
3LUPULJ463412
4STAIOSS61548
5SYKORAP41356
6TORRESR41383
7WINCHESTERB19163
8HEMSKYA3940-2
9REASONERM3334-2
10STOLLJ3841-3
11PISANIF3339-6
12TJARNQVISTD5362-9
13GREENEM3545-10
14SMIDL4354-11
15SMYTHR4657-11
16PETERSENT2234-12
17HORCOFFS4262-21
18SMITHJ3772-34


Colorado


NLastnameIPlusMinusD
1RYCROFTM521340
2RICHARDSONB542430
3HEJDUKM714130
4ARNASONT643727
5SAKICJ674225
6KLEEK815724
7CLARKB724824
8MCLEANB573522
9STASTNYP644222
10BRISEBOISP664620
11LAPERRIEREI583919
12VAANANENO482919
13LILESJ604218
14SKRASTINSK766016
15BRUNETTEA584415
16LAAKSONENA382314
17WOLSKIW453113
18SVATOSM453510


Calgary


NLastnameIPlusMinusD
1LOMBARDIM483613
2TANGUAYA625111
3NILSONM29226
4KOBASEWC36306
5WARRENERR36324
6FERENCEA43430
7MCCARTYD89-1
8HUSELIUSK2933-4
9AMONTET2833-5
10LUNDMARKJ1420-6
11RITCHIEB2835-7
12REGEHRR4453-9
13PHANEUFD7078-9
14LANGKOWD4353-10
15HAMRLIKR6075-14
16FRIESENJ1834-16
17IGINLAJ5269-18
18ZYUZINA2054-34

November 26, 2006

Site Update

Most sites provide some interesting power play and penalty kill statistics. The most basic being sites such as ESPN. However there are a number of stats that are not used at these sites such as my preferred: expected goals and shot quality neutral save percentage, a measure of shot quality. All these can indicate, before it is apparent, that a team has problems in a certain situation. For example I have Edmonton ranked as the worst Power play team in the NHL (slightly below Phoenix) as they have taken very few shots and taken horrible shots. Somehow they’ve managed to score at 6.6 goals per hour, when I would predict they score at 4.3 goals per hour (which I doubt will continue over the course of the season). This is better stated by Andy Grabia one week ago: “The Oilers powerplay got a goal tonight. Thank God. But it wasn't on the 5-on-3. That was wasted by MAB faking the shot about 17,000 times, and the continual passing back and forth along the point. Nor was the goal deserved, although the shot was a beauty. Has this team heard of anything other than a one-timer? Sweet Caroline, our powerplay stinks. And it is not personnel. It's coaching.” You’ll note: they got a goal they didn’t deserve, the statistics agree, Edmonton has gotten a lot of powerplay goals it didn’t deserve. I’ll disagree partly it’s not all coaching as I think the defenseman in Edmonton are not conducive to a productive powerplay, but that’s another issue.

In order to somehow “summarize” this data I created the definitive situational table. I decided to include all data in one massive table due to the fact that I want to be able to see what happens to even strength data when I sort by power play data. In order to make the tables a little simpler I decided to split them up as well (as it’s easy to do so), so there’s separate even strength, power play and penalty kill tables. All columns are sortable, and in general one can spend hours sorting by all 27 columns. I included a goal differential in the separate tables (there was no room in the big one), but I put little weight in it as there’s a lot of random error in the results. This is more data than most people can stomach in one day let alone a few minutes, but I sure some people will like it as much as I do. If there are any errors let me know.


Also, why on earth do the Canadiens have such an amazing penalty kill?

Face-offs: Part I

Since I went through the work to calculate this data for Vic Ferrari as a result of comments in this post. I wasn't sure what I was looking for and still don't. The actual coding is a pain as the NHL does not record whether the face-off is even strength or power play so I had to use my standard penalty prediction method to determine when teams are even. Naturally the more complicated it is there's more chance for error, but the results appear reasonable. So all I'm calculating is the probability of a shot and the probability of a goal after a face-off in a offensive zone. There are two situations: a win and a loss, if you lose you can still battle the puck back and get a quick shot off, but obviously the odds of that are much lower.

Using 8 seconds (2005-2006):
Face-offs aren't recorded as EV/PP so I had to use my penalty prediction of PP/EV algorithm.
Even Strength:
win-shot: shots/face-offs = pct%
Win-Shot: 4622/17334 = 26.7%
Win-Goal: 176/17334 = 1.02%
Loss-Shot: 698/17367 = 4%
Loss-Goal: 34/17367 = 0.2%
Power Play offense:
Win-Shot: 1399/5508 = 25.4%
Win-Goal: 74/5508 = 1.34%
Loss-Shot: 195/4460 = 4.4%
Loss-Goal: 4/4460 = 0.31%
Short handed offense:
Win-Shot: 122/616 = 19.8%
Win-Goal: 5/616 = 0.81%
Loss-Shot: 10/806 = 1.2%
Loss-Goal: 0/806 = 0%

It's interesting, but most shots after face-offs are garbage (shooting percentage half of normal).

  • PP face-off win percentage = 55%. (Players who play more PP time will have high win %, PK players will be lower)
  • Shooting is high: ~25%, even though unsuccessful.
  • I hope there are no bugs in these results...
  • The data is poor; it's possible for a shot to be displayed after a face-off even if it occurred before the face-off.

November 19, 2006

Self Promotion

I know a lot of people don’t go to my statistics website, but in my humble opinion it has a lot of useful features. In the past week I’ve created tougher restrictions for my player lists (at least 10 games played): forwards, defense, goaltenders. I’ve added new features such as team summaries, which shows a shooting graph for and against and general statistics. I’ve also created better navigation from the player list to my team summaries and team rosters. A while back I downloaded all the hockeydb information so I could create neat player information pages with all player information. More importantly, I’ve really worked out some of my bugs in my predictions and now they should be much better and I also included a graph of how my predictions change over time. As a result of changing my code, my past incorrect prediction need to be deleted eventually. A new feature I'm working on is a power ranking system, and this can be seen in my entire NHL list. In any of the lists you can click on the team picture to get to the team pages or the players name to get their page. Many of the columns are sortable as well in each table (just click on the names at the top).

These pages are update every couple of days and should be reasonably accuate. Many of the information presented wont be found anywhere else: such as a goaltenders shot quality neutral save percentage, or a save percentage based quality and quantity. Or goaltenders ability to stop easy, medium and difficult shots. For the forwards and defense I have: expected goals for and against for each player (a better measure than plus minus) all measured in terms of rates rather than absolutes. Along with the standard plus minus measures and points. In the player information page I display their score in each game, this can give you an idea how volatile the scores are, but also how they are performing over time. All these statistics are seperated by power play, penalty kill and even strength as one would expect.

I’m not sure how the website performs, although when I’ve tested it from remote locations it appears to work well, my database doesn’t scale well so as the season progresses some of the pages could take some time to process.

It would also be nice if readers let me know about features/data they want to see on this website. I've primarily made this website for myself, but feel others can benifit and it's easy to add more information to these pages. You can post requests in the comments. And of course if you find any bugs let me know, that would be great.

November 18, 2006

Overtime going into extra innings.

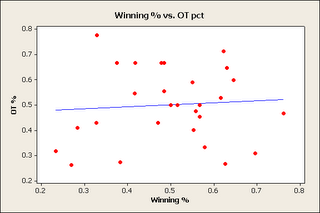
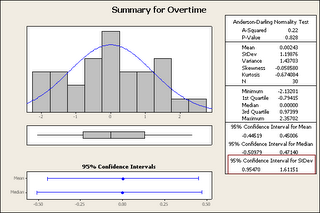
In the last article I concluded that: “I have good reason to conclude that overtime occurs randomly given any two team and that the results once in overtime are completely random.” My analysis before was focusing on global overtimes in order to know how to predict what games will go to overtime in order to make my point predictions more accurate. The graph below shocked me the most during my previous analysis, that is to say teams with a lot of regulation wins were unable to perform better in the overtime session, this is both shootouts and the 5 minute four on four. Of course I wrongly concluded that this suggests the results are random, however I think most readers will agree that if skill doesn't determine who wins, then what on earth does win?


Randomness
Randomness naturally creates clusters and anomalies these should be expected. The question to ask is "are there too many anomalies?" Now a season is only 82 games and there are 30 teams, most of which see around 20 overtimes. One of the beautiful things about this analysis is that we know the distribution for random binary variables. That is to say that the mean = probability (p) and the standard deviation sqrt(n*p*(1-p))/n [n = number of events]. If a variable is perfectly random with equal chance for each side to win, then we obviously expect the probability to be 50%, which suggests that the error is sqrt(n)/(2n) or 50% ± sqrt(n)/(2n). So if you were to flip a coin 4 times you'd expect to get heads: 50% ± 25%, for a 95% confidence interval of (0%, 100%), of course this is a 100% confidence interval (you can't ever get above 100% or below 0%, so I'm 100% sure that 4 coin flips will land in that range) as a result of problems with approximating the normal distribution with the binomial distribution with small n.

In the NHL you can always find teams that fall outside if the normal 95% range due to the fact there are 30 teams, and if I'm 95% confident that each team is in this range than I could say that 5% should be outside of this range so 1.5 teams should be on the outside on average, so 2 teams outside this range is actually reasonable. If you wanted a range that includes all teams you'd want a 99% or 99.5% range (3 standard deviations).

Modeling the Overtime
I could use theory to analytically calculate the values for winning in overtime, but it's often easier to write a script to simulate the results. First I simulated the 4 on 4 assuming team A was 9% better than team B. So team scored at a rate of 1.2 goals per 20 minutes and team B scored at a 1.1 goals per 20 minute rate [Defense is ignored]. These numbers accurately reflect the actual scoring in the overtime. I simulated 50,000 times so the results should be ± 0.2%. The result: A team who is 9% better wins 52% of the time. The shootout relied on skill a little more, that is to say a team who has a 10% better shooting percentage (whether this comes from shooting or goal tending tending is irrelevant) results a team who is 10% better than team a wins 54% of the time. So shootouts should correlate about twice as much as overtime. There is only a 50% chance to make it to a shootout once you get to the overtime. As I mentioned before there is correlation between winning in OT and winning in regulation, but it's not significant. This often means that given more data there could be a relationship (this is always possible), but we are limited because there is only 1 season of data for this year. There is a more significant relationship to winning in shootout over the four on four portion as predicted by this simulation. Of course if you look at the variables and do regression nothing comes out as important, for example: save percentage doesn't appear to matter in the shootout. So we have theory that say better teams should win, but they don't appear to, but even if they did win at 52% it would be hard to detect (and having 2% error in a prediction algorithm isn't that bad).

Actual Results
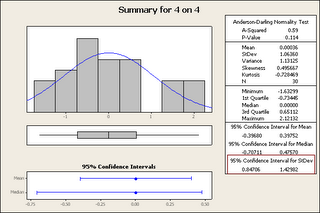
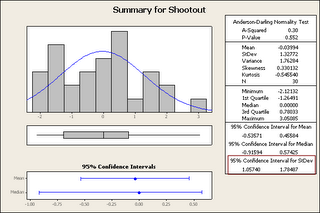
The easiest way to test if data is random is compare it to what true randomness would predict. Each team has a given percentage of winning and compare that to how it would "normally" distribute if it were random that is to say calculate a z-score = 2*(team score - 0.5)/(sqrt(n)/n) and then plot the z-scores. [error/standard deviation] For example Dallas' 12-1 works out to 2*(12/13-0.5)/(sqrt(13)/13) = 3.05. 3. In other words the error is 3 standard deviations away from average, which is extremely rare (0.25%), but the probability that one team is 3 standard deviations away in a season is 8%, which is low, but not unreasonable. So Dallas probably was good and lucky. Not sure how physiology plays into all this: that is to say, if you go into Dallas knowing they're 11-1, you will think you will lose and hence you lose. Once you have a set of z-scores for each team you can plot them. If they're perfectly normal (mean = 0, standard deviation = 1) then you can conclude that the variability is identical to that of randomness (whether this means it's random is of course not determined). Minitab creates nice summaries of this data and they include the "standard deviation of the standard deviation". Like all statistics neither the mean or standard deviation is known and we must estimate both and with every estimate there is error and so the standard deviation has error just like the mean, now if this error doesn't include 1 (the value required for randomness) at a statistically significant level I can conclude this data is statistically significantly not random, however if it does include 1 that would mean that I must not reject* the possibility it's the same as randomness. So below are these statistics and in the red box I have a 95% confidence interval for the standard deviation.
Summary of the Graphs
Now if you understood any of that you would have noticed that the 4 on 4 and overtime in general included 1 and the shootout did not. That is to say there was statistically significantly more variability in the shootout than we would expect if it were random. So Dallas probably wasn't 3 standard deviations from their actual score (maybe 2.5 or 2, who knows), but the others were too close for this small data set to determine if it is random or not (I'll will add this years data at the end of the season and see if it becomes significant). Of course all these standard deviations appear more variable than randomness and it's only on the margins that we see

My Predictions
The important variable: overtime, includes 1 and as such there is insignificant evidence at this point to consider overtime determined by anything other than randomness, since overtime is what I care about (who gets the extra point) and not if the game is a shootout or won in the 4 on 4 I have choose to use a random variable to predict overtimes. I will again remind the readers that not only does overtime have very similar properties to randomness it doesn't correlate to skill, so bad teams win just as often as good teams do. This means that there is no useful way to actually predict who will win the OT even if I knew it weren't random. Does this mean that overtimes are the same as a random variables: absolutely not they are extremely complicated, have 18 skaters, a goalie, a coach (and assistants), referees, dynamic wind, air and ice variables not to mention physiological factors, however at this point, based on the data available to me, the best model is a random variable.

Challenge to Everyone
I challenge the readers to prove me wrong, that is to say to show that there exists a statistically significant (95% confidence) variable that can predict the overtime results.

*Hypothesis tests:
Has two hypothesis:
Null hypothesis claim initially assumed to be true [the data is random]
Alternative hypothesis: a assertion that is contradictory to the Null hypothesis [the data isn't random]
When we do the test we have two options:
Reject the Null hypothesis in favour of the alternative [reject: "the data is random" for "the data isn't random"]
or
Do not reject the Null hypothesis and continue with the belief that our initial claim was true ["the data is random"]
This does not prove the data is random, simply that its not different enough from random that we should conclude otherwise. This is exactly what I'm saying: there's insufficient evidence for me to use anything other than a random variable in my model.

Due to the nature of this site I'm often a little loose on the concept of "not rejecting" and"accepting" (they're different), just because this isn't supposed to be perfectly formal.

November 17, 2006

Predicting what games go to Overtime

Problems with current predictions

So I’m going over 2005-2006 data to enhance my standings predictions. I was a little shocked that for example the northwest division when sorted by point projections was negatively correlated to actual points. In other words Minnesota with 22 is projected to be the worst (75 expected points) and Avalanche with only 16 points are expected to get 109 expected points. So I tediously went through the 2005-2006 data testing alternative algorithms. Of course season of testing isn’t going to be accurate, but it’s the only set of data that complete enough to test with (I need a lot of shot data, which I don’t have for 2003-2004, plus the NHL changes). My current algorithm simply uses expected goals vs. actual goals against (with a special averaging function that scales down blow outs); this is the best predictor for the last half of the season based on the first halves data. Certainly Minnesota is falling because they miss Gaborik, not sure if my algorithm can pick up the changes that quickly, but obviously he’s an important part of the team. The Canucks who have a negative goal differential are predicted to get 104 points, which doesn’t make sense either, but then again their shooting percentage is at a low 5.6%, and I was expecting it to be at 6.6%, so assuming expected goals accurately predict scoring the Canucks should score at 6.6% the rest of the season rather than 5.6% (so the Canucks have seen tougher goaltenders). It’s hard to argue with the prediction that does better than a standard Pythagorean prediction, so with its problems I decided to keep it.


About Overtime

But, in the process I discovered something interesting about OT’s. What’s interesting about overtime is that it should be a function of skill that is to say if two equal teams play together they should be more likely to go to overtime than let’s say Phoenix and Detroit, however a quick binary regression shows there’s little significance to this assumption on a game by game basis. 22% of all games go to OT with little skill reasons for this a regression shows a slight favour of good teams to go to overtime less, a better way of saying this is that Ottawa and Detroit went to overtime a lot fewer time than average teams. Maybe more interesting is that there is virtually no correlation to winning percentage outside overtime compared to teams records in overtime. It shouldn’t be too much of a surprise that the overtime system in the NHL is completely random. I’m saying all this to say that I have good reason to conclude that overtime occurs randomly given any two team and that the results once in overtime are completely random. Basically every game has a ¼ chance of going to overtime and then each team has 50% chance of winning.


Random Overtime

The consequences may not be obvious immediately, but the first thing that comes to mind is that this guarantees 22% of the NHL standings are the result of pure randomness (above the normal randomness you would normally observe). What I’m saying is that teams will get about 28 free points (95% confidence interval of (21, 35)) as you can imagine the team or two who only get 20 points will have to be 7 points better (10% better) than average just to make the playoffs or the team who gets 34 points in overtimes (10% worse). Minnesota for example last year got 20 points in 14 overtimes, getting 84 points over the season, if they have been average and got 28 points they would’ve had 92 points and proabaly wouldn’t have traded away Mitchell and Roloson and possibly done very well in the playoffs.

Obviously the overtime is fun to watch, its always exciting to see shootouts, there’s no question there, but if you think about what I said, you’d realize that determining who gets the extra point via a coin toss would produce the same results. Personally I find this frustrating; if it’s so important to have a winner this works, but it simply hurts the overall ranking of teams and of course this is on top of the scheduling problems. Interestingly this should make the NHL appear more competitively balanced as it makes the results come close to random.

Fixing my Algorithm

What does this mean to me? Well I realized my current algorithm that assumed the better team wins the overtime more often then the worse team was incorrect and also I was incorrect that overtimes only occur with teams with similar skill. This means that I will randomly predict overtimes for all games played. This means if a team is predicted to have overtime with Detroit, for example, this will give them free points they probably wouldn’t have gotten otherwise. This of course is a lot easier to program than the other method of trying to find correct cut off percentages (eg. A game predicted to be won 53% of the time goes to overtime). Of course this will make bad teams look good because they get a number of free points. For example St. Louis last year got 29 out of 57 points, over half, in the random overtime.

November 16, 2006

More on Diving

A third diving infraction results in a $2,000 US fine; a fourth warrants a one-game suspension. "One of the impediments to the enforcement of hooking and holding and interference was the diving," Campbell pointed out. "Or the embellishment of those calls to draw a penalty. We knew this would happen because players are competitive and they do what they have to do to win the game," explained Colin Campbell, the NHL's disciplinarian. "So this is how the players and the managers have asked us to do handle it."

Avery was recently fined 0.09% of his annual income and I guess that means it’s time to write up about diving again. A number of people liked my diving article written a while back, which suggested unless the NHL makes drastic changes to their rules they will be unable to control diving as players still benefit more than they lose by diving. I wanted to write a continuation, with a little data this time. I first wanted the opinion from the NHL on how they’re doing on the diving front, I discovered that articles about diving are hard to find because it seems every hockey writer likes to say that goalies make a “diving save”, but that’s an entirely different issue, but I did find a little blurb at USAToday, which makes two simple arguments about the positives associated with diving enforcement this season.

At this point last season, Walkom says, about 20 diving penalties had been called. "We are probably closer to 30 this season."

Walkcom is very correct diving penalties are up about 50% this year, but as I often say 50% of nothing is well nothing. Last season there were 109 diving calls. At this point I have 25 in 2005-2006 and 35 this year, meaning of course that since the article was written things have been a lot closer to even. So whether the NHL maintains their level of diving calls is questionable (as they want to make a statement at the beginning of the season so they can have nice quotes in articles).

The other difference, according to Walkom, is about half of the diving calls this season were called without being connected to another penalty. Last season, diving calls were primarily called in conjunction with a foul. For example, one team's player would be called for hooking, and the "hooked" player would be called for embellishing the fall to draw a referee's attention.

In 2005-2006 there were 109 diving calls 89 of which were associated with other penalties for the other team (82%). This year of the 36 diving calls 22 were associated with other penalties, which worse out to 61%, but increasing, that is to day after that article was written there has been a few less diving without hooking calls, I am always glad to see this increase, although in my opinion as long as the hook is still called the diving call has no value (there’s no cost). This means that in 266 hockey games there were 14 diving calls without a penalty on the opposing team. 14 penalties become about 2.5 goals against. Over the course of the season this is about 65 power plays and about 12 goals against, distributed amongst 30 teams, so this cost each team about 0.07 wins (~$70,0001), I’d say most players would call that just the cost of doing business.

There were 1251 “subjective” calls this season, which includes, hooking, tripping, interference and holding the stick all of which I consider are “dive-able” I’m sure people could think of more, or debate my choices of penalties, but that wont effect this analysis significantly. Of these 1251 penalties 48 were associated with a call to the other team at the same time so 1203 should result in a power play, which of course is 86 times as many as the diving calls. Just looking at that ratio 86:1 one can figure out you should probably still dive. There is no good way to determine the number of players that actually diving, but if you look at 2005-2006 there were 84 players penalized for diving and I have 762 players listed in my database with more than 20 games played, which works out the NHL declaring that 11% of players dive. Now why would these players not dive for almost every call, but I’ll leave that for the readers to figure out. So let’s say that 11% of the above calls were associated with diving 138 and then we know there have been 36 diving calls, or 26% of dives resulted in diving calls (this is pretty high), of these dives 40% of them resulted in only the diving call, which works out to 12% of dives resulted in just a diving call. So here’s the choice to dive: 74% power play – 16% 4 on 4 – 10% just diving call. It should be obvious that the choice would be to dive, unless that $1,000 fine is that big of a deterrent to someone who makes >$500,000.

Of course the 138 dives in the first 266 games is about 638 over the season with 472 power plays for the diver, or about 80 goals distributed amongst 30 teams or 2.6 goals per team, which works out 0.5 of a win or about $500,000, that’s of course assuming the NHL has a fixed number of divers, if you start to assume every player dives 50% of the time for example these numbers will really start to get big, but as you can see $500,0001 is greater than $70,0001 or 2.6 goals for completely dominates the cost of 0.4 goals against. Of course it’s hard to say what percentage of the time a power play would be called without the dive.

This wouldn’t be as interesting if I just talked about the big picture; each diving call has a diver associated with it and a referee who calls it. For example last season only 4 players got more than 2 diving calls against them, Ilya Kovalchuk had 4, here’s a dominant player who can skate circles around defense it should be no surprise that a guy like Kovalchuk is on the correct end of a lot of calls if he’s actually diving or just getting diving calls because he’s always being hooked and referees randomly call dives would be hard to determine. There are three tied for 2nd and the list includes Gaborik, Zubrus and Afiniganov, now why this list includes 4 Russians (Czechoslovakia or USSR born) is a good question, are Russians bad actors, do Russians have less integrity or do the NHL referees have a bias against Russians (Don Cherry theory)? For my part I won’t conclude any of the three, but say it’s interesting that there are four Eastern European skaters in the top 4. However, the important thing is that all these skaters are strong, fast and likely draw a lot of their teams’ penalties, I bet the three diving calls didn’t hurt any of their teams. Of course if Kovalchuk gets 4 again this season he’ll have a one game suspension, if you estimate Kovalchuk’s value of the season to be about 5 wins (based on player contribution), that works out to 0.06 wins for the suspension or doubles the cost to the team, but still doesn’t exceed the benefits. Of course Kovalchuk will loose a lot of money with a one game suspension.

It’s interesting, but you need referees to make these calls, and well spotting a dive isn’t the same as spotting a hook as it’s subjective, one referees dive is another fall. There are a few this season who call over 0.2 dives per game in 2006-2007: Brad Watson, Dennis LaRue, Dean Morton, Michael McGeough, Brad Meier, Dan O'Rourke, or above 0.2 in 2005-2006: Stephane Auger, Dan O'Rourke, Bob Langdon, but mostly a lot of the referees don’t call any diving penalties (<0.1), style="">

Personally I believe every player dives to a certain extent, it’s when the player goes over a certain NHL determined line that they call the diving penalties. Everyone I’m sure has seen replays of a stick getting very close to someone’s face and their head whipping backwards when it doesn’t touch, of course this could be the reaction to something shoved that close to your face or it could be an embellishment. You of course could do studies on “correct” reactions to things like sticks being shoved very close to someone’s face in order to determine what embellishment is. The same goes for a hook, once the player feels the hook, just stop exerting any balance force and fall naturally, that’s an undetectable dive. I’m sure everyone has seen this one a player holds onto another players stick under their arm and when the player pulls to get their stick lose the other player falls. There are many ways players have found to get power plays and most of them aren’t very honest, but the NHL has chosen to encourage them by calling the penalties and not having much if any consequences for doing so. I wish the NHL good luck, but their enforcement of diving is going no where.

[1] - I approximate the value of a win based on the salary cap of approximately $41 million. That is to say the average number of wins is 41 and the average team spending is $41 million, so one win is worth around $1 million. And it takes about 5.5 marginal goals to get a win.
November 12, 2006

Ottawa Senators

There have been a number of articles written on Ottawa, and for good reason. Here’s a team that’s played well, but is ranked second last in the east (just above Philadelphia). Interestingly, but my algorithm is predicting a great 123 point season or 110 points in 66 games (77% - subtracted 8 points from OTL’s). According to the Pythagorean prediction the Senators should be playing at 57%. However in the last 7 games they’ve managed one win and given all those games were coin tosses there’s a 6.25% chance you lose all but one of those games and if they were a 57% team on average there’s a 2.8% chance of losing those 7 games. Also those loses include two losses to 13 point Boston. Interestingly, it seems that every win is a blowout and every loss is a one goal affair as well stated by Michael from LCS Hockey : “But even that number is misleading. Twenty-one of Ottawa's 37 goals came during the club's three-game binge against New Jersey and Toronto, meaning the Sens have managed just 16 goals in their other nine games.”

So what is going on? Obviously luck plays a certain factor here, but I feel that one cannot look at the Senators performance without thinking, what might be causing. McHockey notes the terrible power play for the Senators. And Michael from LCS Hockey concludes that Ottawa needs a second line center. Kelly Hrudey made some excellent comments on Martin Gerber and how he’s struggling to see pucks through traffic. However, what I’ve noticed is that Ottawa has lost a significant number of games because the other team comes back from a deficit. If you go over the last 7 losses you’ll see that they’ve lost all their games as a result of their second or third period. Boston outscored Ottawa 3-2 in the second on the 11th, Atlanta got 2 in the third to win 5 to 4, Carolina got 2 in the third to win 3 to 2, Montreal scored two in the second to win 4 to 2 and finally on the 28th of October Boston got two in the third to win 2 to 1. Even in the 3 game blowout streak Ottawa only managed 1 goal on average in the third period. Of course every game has some chance of a comeback, but losing so many games that should be won asks questions about what’s going on with Ottawa’s defense in the third period. A bad power play or bad goal tending has nothing to do with when you lose the game. With Ottawa's ability to score goal tending shouldn't be a big issue, neither should the power play if they can get the goals at even strength instead. A better way of looking at this information is an actual break down of their game per period. What's interesting is they start out so well, allowing only 1.7 goals

Another way of looking at the above is a break down of the teams’ performance by period. If you look at it this way the team allowed only 1.7 goals against per hour in the first (and only 24.6 should per hour). So without further ado, here’s the table:


PFORAGAINST
SEGGSQN%SEGGSQN%
131.53.183.1990.824.61.761.6991.2
235.64.444.3191.136.93.333.5690.2
332.62.672.2592.330.62.793.1989.5

Before delving too much into the table above I should say that:
P stands for period.
S stands for shots
G for goals
EG expected goals – an average number of goals based on the quality of the shots, SQN% - is the save percentage of the goaltender if he saw average shots (scales out the fact the shots are easier or harder to stop).

Now SQN% per period is correct to about 3% so a difference of 1 or 2% is perfectly normal so the differences in scoring and goal tending per period could be just the result of error (randomness). So certainly the SQN% show that Ottawa has been a bit unlucky in the third as their shooting percentage falls to 7.3% and save percentage falls below 90%. Scoring (EG, and G) are both accurate to about 0.7, similarly a difference of 4 shots is not significant. This certainly makes the shots provided to the opposition in the second period statistically significantly different (although actual scoring and expected goals aren’t statistically different). In general this is true as the NHL has about 10% more shots in the second period compared to the first or third. But you can see the Senators were able to more than outperform their chances against with their chances for, generating an astounding 4.3 goals for per hour in the second compared to 3.6 against, although many of these goals came in the blow outs.

The third period is really where the luck part strikes you, of course you can’t conclude whether this states their unlucky in the third or lucky in the first, but it’s probably a bit of both. It’s not like Ottawa isn’t shooting the puck in the third or getting good chances, it appears the opposition is simply getting lucky (they good shots aren’t going in). It’s interesting, while there’s a general trend for worse than average goal tending in the third period (SQN%: 90.9% vs. 90.3%), Ottawa has gotten better than average goal tending against them (Their shots are being stopped too often).

Basically what’s the problem: Ottawa hasn’t scored enough in the third period. If Ottawa could play as well in periods 2 and 3 as they did in the first they'd be doing just fine. If the first period becomes more like the 2nd and 3rd then their in trouble. I don't have anymore to say because I wanted to get this finished before the Canadiens game at 7:30 EST.

November 7, 2006

The Draft

The 2006 in long forgotten, but I was looking through player stats and arguably Chris Pronger is the most dominating player in the NHL at this time (certainly in the top 10), but I noticed he was picked second to Alexandre Daigle. Daigle, as most people know by now, hasn’t done all that much in the NHL. Daigle is averaging half a point per game and recently played a number of games in the AHL and is now playing in a Swiss league. Of course I found all this out by looking at HockeyDB’s nice draft pages. What I noticed is that even low pick players were some able to get into the NHL and do well. For example Pavol Demitra (picked 227th) is averaging a point a game and Kimmo Timonen (picked 250th) is averaging 0.85 points per game. So I was wondering if teams could actually determine a player’s skill through the draft or if it’s mostly guess work.

Before going any further I should note I rescaled defenseman's points by 1.7 so they would fit in the model (this is a number I found analyzing assists), I could’ve created two separate models this just simplifies the models. Also I am only measuring offense so defensive players will look bad, but I’m assuming their randomly distributed so it shouldn’t have a significant effect (teams substitute defense for offense equally in high and low picks).

The first thing I wanted to know is which draft picks are playing in the NHL from that year. So I deleted all players with less than half a season of games (less than 40) Shows the obvious occurs: that is to say teams prefer to use high draft picks over low draft picks. I don’t think you needed a mathematical analysis to figure that out, but at least it agrees with the intuition. The graphs below show a histogram of pick number after I deleted the picks that didn't play in the NHL enough. Basically each bar counts how many picks in the given range who played a significant number of games in the NHL.

1993:
1992:

But the real question is can teams pick a winner. The answer to a certain extent is yes and well no. For example if you look at the first 100 draftees, you get correlation equation something like:

Points per game (1993) = 0.508 - 0.00198 “Pick Number” (insignificant)
Points per game (1992) = 0.578 - 0.00335 “Pick Number”
Points per game (AVG ) = 0.550 – 0.00250 “Pick Number”

Problem is after the first 100, the relationship is much less clear and in fact can have an increasing trend.

1993:
1992:

Why might this be? It would appear that picking is neither random or exactly negatively correlated to pick order. One theory is that good teams find players no one else does knowing that no one knows the player they can postpone this pick to a later round. There are only a few players who actually made it to the NHL and did well so there are few players to study this with, but teams who picked better than average players in
late rounds (1992, 1993) include:
Detroit, Quebec, Calgary (2), Toronto, St. Louis (2), Edmonton, Hartford, LA (2), Ottawa

Just because a team picked a good offensive player doesn't mean they're great for example many readers might not know who their "good pick" was because he played only 57 games: defenseman Ilya Byakin, who has been successful in Europe.

Also if you look at both scatter plots you'll notice the quadratic regression line have the minimum at the same value of picks or 150 (~ round 5).

This may suggest to some that some players who never get a chance would actually be good in the NHL. Naturally on the surface I agree that there exists a number of low pick players who could be amazing in the NHL, but for whatever reason they're not getting the opportunity. But I suspect those who don't make it to the NHL mostly do so because they lack the skills and possibly the motivation and effort. For example a player who was picked 250th overall might be discouraged and give up.


Anyway I bumped into this today and since I had a little time and haven't posted anything interesting in a while I thought I'd post something a little different. This could easily be done for other years in the same ways, I suspect it would have similar results.